In our recently published work on screening for generality, we selected our panel of model substrates in part using cheminformatic techniques. We're not the only people to do this, obviously: cheminformatics is a busy and important field, and even in organic chemistry there's lots of papers using similar techniques these days (I liked this work from the Doyle lab). But since often the people who would benefit most from a new technique are the people who might be most intimidated by wading though documentation, I thought I'd post some simple example code here that others can copy-and-paste and modify to suit their own ends.
There are lots of ways to approach plotting chemical space, but fundamentally all approaches must address two big questions:
I chose a relatively simple approach to the first question: molecular fingerprints (if you don't know what these are, I liked this introduction from Towards Data Science). Based on Greg Landrum's findings, I used the RDKit7 fingerprint. RDKit is the premier cheminformatics package, and well worth a download for anyone interested in these concepts.
For the second question (dimensionality reduction), I used the UMAP algorithm. There are other approaches to this, like tSNE or PCA, but in my opinion there are relatively convincing reasons to favor UMAP (although this paper points out some limitations).
Without further ado, then, here's some example code to take a list of IUPAC-type names and generate a 2D representation:
from rdkit import Chem
from urllib.request import urlopen
import re, tqdm, sys, umap
import numpy as np
import matplotlib.pyplot as plt
# make matplotlib look good
plt.rc('font', size=11, family="serif")
plt.rc('axes', titlesize=12, labelsize=12)
plt.rc(['xtick', 'ytick'], labelsize=11)
plt.rc('legend', fontsize=12)
plt.rc('figure', titlesize=14)
%matplotlib inline
%config InlineBackend.figure_format='retina'
# function for turning names into SMILES strings, because I find writing SMILES by hand impossible
def smiles_from_name(name):
try:
url_name = re.sub(" ", "%20", name)
url = 'http://cactus.nci.nih.gov/chemical/structure/' + url_name + '/smiles'
smiles = urlopen(url, timeout=5).read().decode('utf8')
return smiles
except Exception as e:
print(name + " failed SMILES conversion")
class THbC():
""" A tetrahydrobetacarboline. """
def __init__(self, group, substituent, color="grey"):
self.name = f"2-benzyl-1-({group})-{substituent}2,3,4,9-tetrahydro-1H-pyrido[3,4-b]indole"
self.smiles = smiles_from_name(self.name)
self.mol = Chem.MolFromSmiles(self.smiles)
self.fingerprint = None
self.color = color
def get_fingerprint(self):
if self.fingerprint is None:
self.fingerprint = Chem.RDKFingerprint(self.mol, maxPath=7, branchedPaths=False)
return self.fingerprint
# I just wrote out a lot of aromatic groups...
groups = [
"phenyl", "4-methylphenyl", "4-methoxyphenyl", "4-fluorophenyl", "4-chlorophenyl", "4-bromophenyl",
"4-(trifluoromethyl)phenyl", "4-nitrophenyl", "4-cyanophenyl", "piperonyl", "dihydrobenzofuryl",
"3-methylphenyl", "3-methoxyphenyl", "3-fluorophenyl", "3-chlorophenyl", "3-bromophenyl",
"3-(trifluoromethyl)phenyl", "3-nitrophenyl", "3-cyanophenyl", "2-methylphenyl", "2-methoxyphenyl",
"2-fluorophenyl", "2-chlorophenyl", "2-bromophenyl", "2-(trifluoromethyl)phenyl",
"2-nitrophenyl", "2-cyanophenyl", "2-pyridyl", "3-pyridyl", "4-pyridyl", "2-thiophenyl", "3-thiophenyl",
"2-furyl", "3-furyl", "2-quinolinyl", "3-quinolinyl","6-quinolinyl", "5-quinolinyl", "8-quinolinyl",
"5-indolyl", "3-indolyl", "7-azaindol-3-yl", "2-pyrrolyl", "3-pyrrolyl", "2-thiazolyl", "4-thiazolyl",
"5-thiazolyl", "5-phenylisoxazol-3-yl", "imidazol-2-yl" "5-pyrimidyl", "5-indazolyl", "3-pyrazolyl",
"4-pyrazolyl", "4-imidazolyl"
]
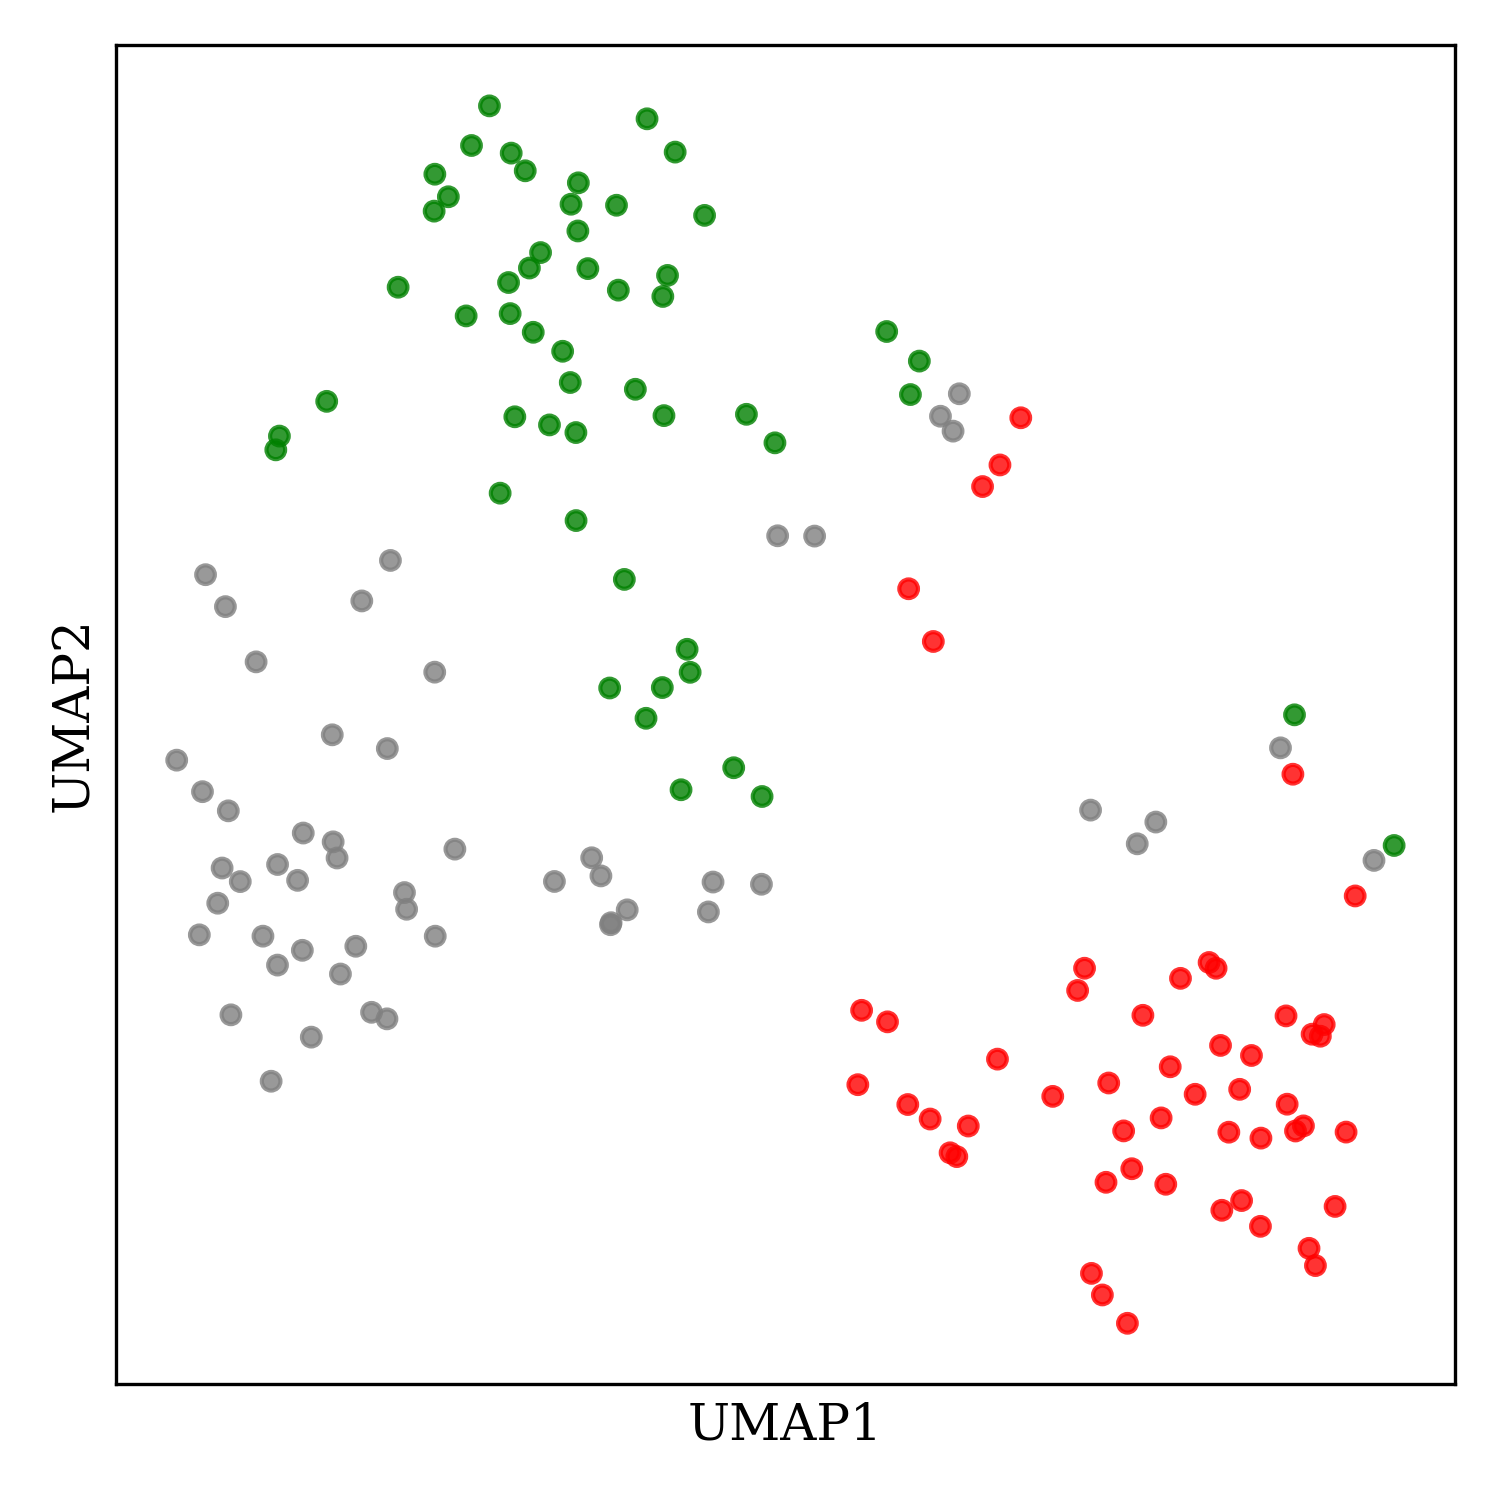
# substituents on the indole ring, and corresponding colors
subs = ["", "6-methoxy", "6-chloro"]
colors = ["grey", "red", "green"]
# build THbC objects (this might take a minute or two)
mols = list()
for group in tqdm.tqdm(groups):
for sub, c in zip(subs, colors):
mols.append(THbC(group=group, substituent=sub, color=c))
# generate UMAP embedding
crds = umap.UMAP(n_components=2, n_neighbors=20, min_dist=0.1, metric="jaccard").fit_transform([m.get_fingerprint() for m in mols])
# plot the result
fig, ax = plt.subplots(nrows=1, ncols=1, figsize=(5,5))
plt.scatter(crds[:,0], crds[:,1], c=[m.color for m in mols], s=20, alpha=0.8)
ax.set_xticks([])
ax.set_yticks([])
plt.xlabel("UMAP1")
plt.ylabel("UMAP2")
plt.tight_layout()
plt.show()
This code generates the following image:
Although this program is a little clunky (slow calls to the CACTUS web service), it works well enough and is easy to modify as needed (to label the individual molecules, or apply a clustering algorithm to pick out model substrates). I hope you find this useful!
Update: as of November 2024, you can generate plots of chemical space like this through Rowan, my computational chemistry startup. You can read more about this feature on our website.