While IR spectroscopy is still taught in introductory organic chemistry classes, it has been almost completely replaced by NMR spectroscopy and mass spectrometry for routine structural assignments. Still, IR spectroscopy offers unique advantages to the mechanistic chemist: the short timescale of IR allows for the observation of transient molecular interactions even when slower techniques like NMR only yield time-averaged data, and IR absorbances can easily be perturbed by isotopic substitution while leaving the underlying potential-energy surface unchanged.
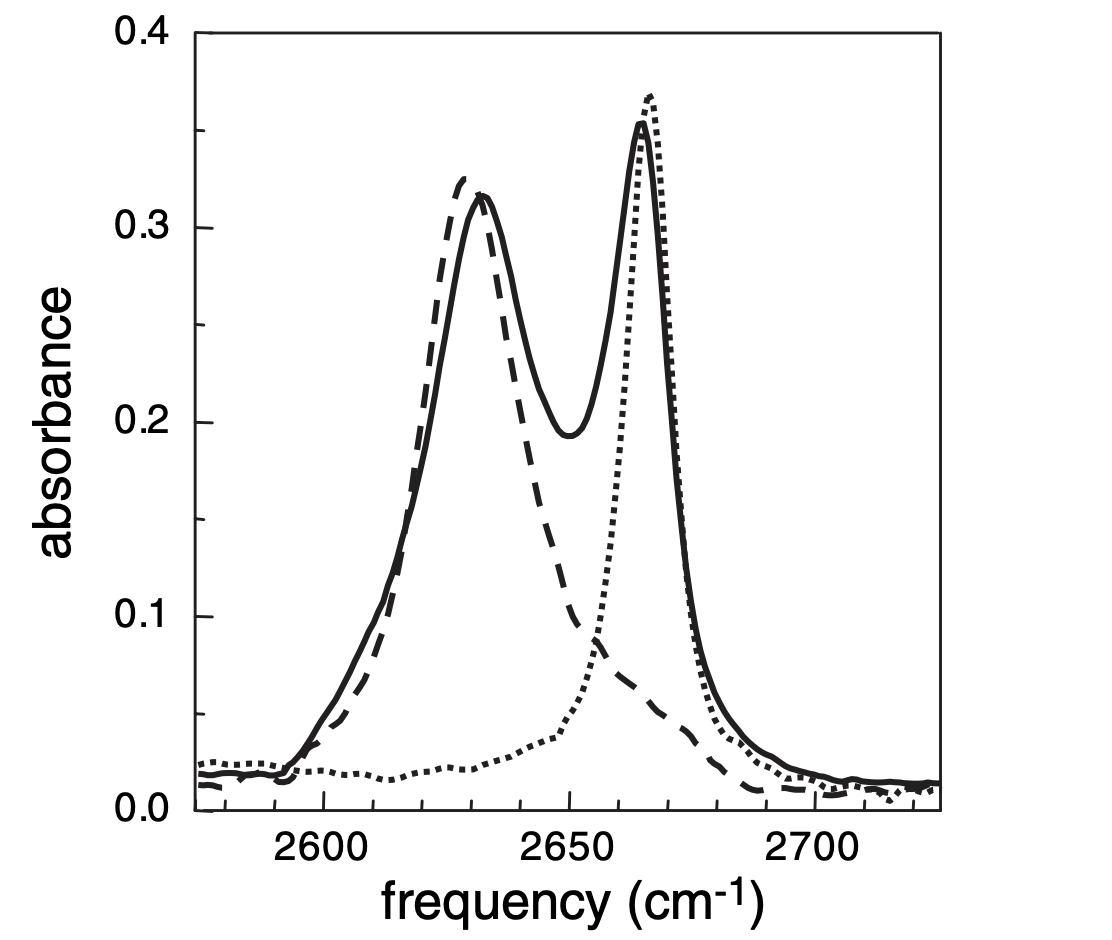
These advantages are nicely illustrated in the IR spectrum of a mixture of phenol, benzene, and CCl4, which shows two peaks corresponding to free phenol (2665 cm-1) and phenol complexed to benzene (2631 cm-1). (The phenolic proton was replaced by deuterium, moving the O–D stretch away from C–H stretches and into a vacant region of the spectrum.) From the standpoint of assessing purity, it might be upsetting that a pure compound shows two peaks; from the standpoint of a mechanistic chemist, the ability to distinguish two different solvation environments experimentally is incredible.
Unfortunately, measuring this spectrum tells us about the thermodynamics of the equilibrium, but not the kinetics; there’s not a good way to determine how fast these two species are exchanging from these data.1 In 2005, Fayer and coworkers developed a pump–probe infrared spectroscopy method called “2D IR” to tackle this problem. In 2D IR, the system is excited, allowed to evolve for a variable length of time Tw, and then triggered to emit a vibrational “echo” (in analogy to spin-echo NMR experiments) which still contains phase information from the original excitation. (There are a lot of non-trivial spectroscopic details here which I don’t really understand.)
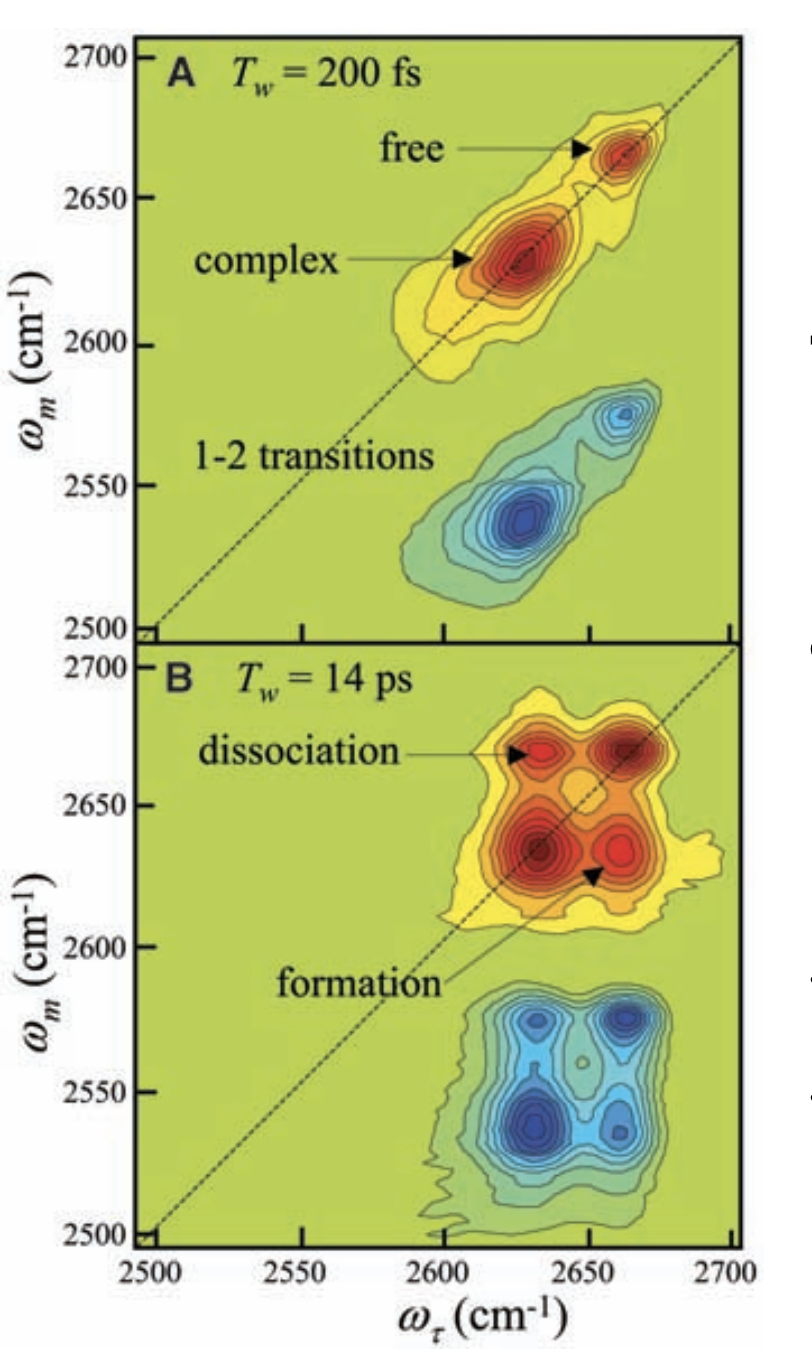
The net result of this is a two-dimensional plot showing initial and final frequencies, in which cross-peaks represent molecules which have moved between one state and another during Tw. By surveying a range of Tw values, the kinetics of exchange can be quantitatively determined: in this case, the time constant τ was found to be 8 ± 2 ps. This result might not seem thrilling (“fast exchange is fast”), but this experiment can be used to measure rates of phenol dissociation from electronically-varied aromatic rings, or compared to results from molecular dynamics simulations for benchmarking purposes.
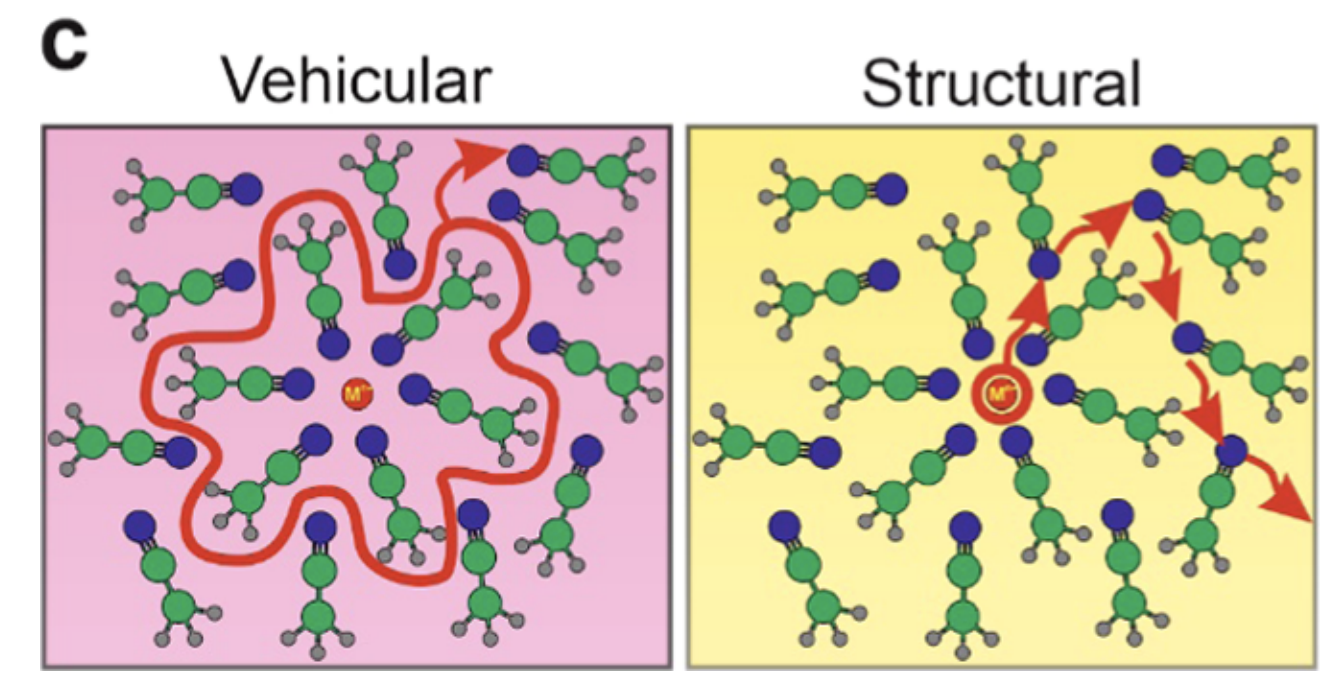
While many groups are now using 2D IR, this recent paper from Tokmakoff and coworkers studying superconcentrated electrolytes stood out to me as particularly exceptional. In superconcentrated solutions like those found in batteries (e.g. 15 M LiTFSI in acetonitrile), the extreme salt concentration leads to high viscosity and substantial aggregation, leading to questions about how charge transport in batteries occurs. Some simulations seem to suggest that, rather than “vehicular diffusion” wherein a cation diffuses along with its solvent shell, charge transport occurs through “structural diffusion” involving breaking/reforming of cation–solvent interactions. (This is analogous to the Grotthuss mechanism of proton transport in water.)
Since distinct C≡N stretches are visible for cation-bound and free acetonitrile, it might seem straightforward to simply measure time evolution of the cross-peaks and thereby determine the rate of solvent exchange. Unfortunately studying exchange in the bulk solvent is complicated by the fact that direct vibrational energy transfer can occur through collisions, meaning that cross-peaks are observed even in the absence of exchange. The authors solve this problem by using a mixture of D3CCN and D3C13CN: while cross-peaks between the heavy and light isotopologues can only occur through energy transfer, cross-peaks between the same isotopologue can also occur through chemical exchange.2
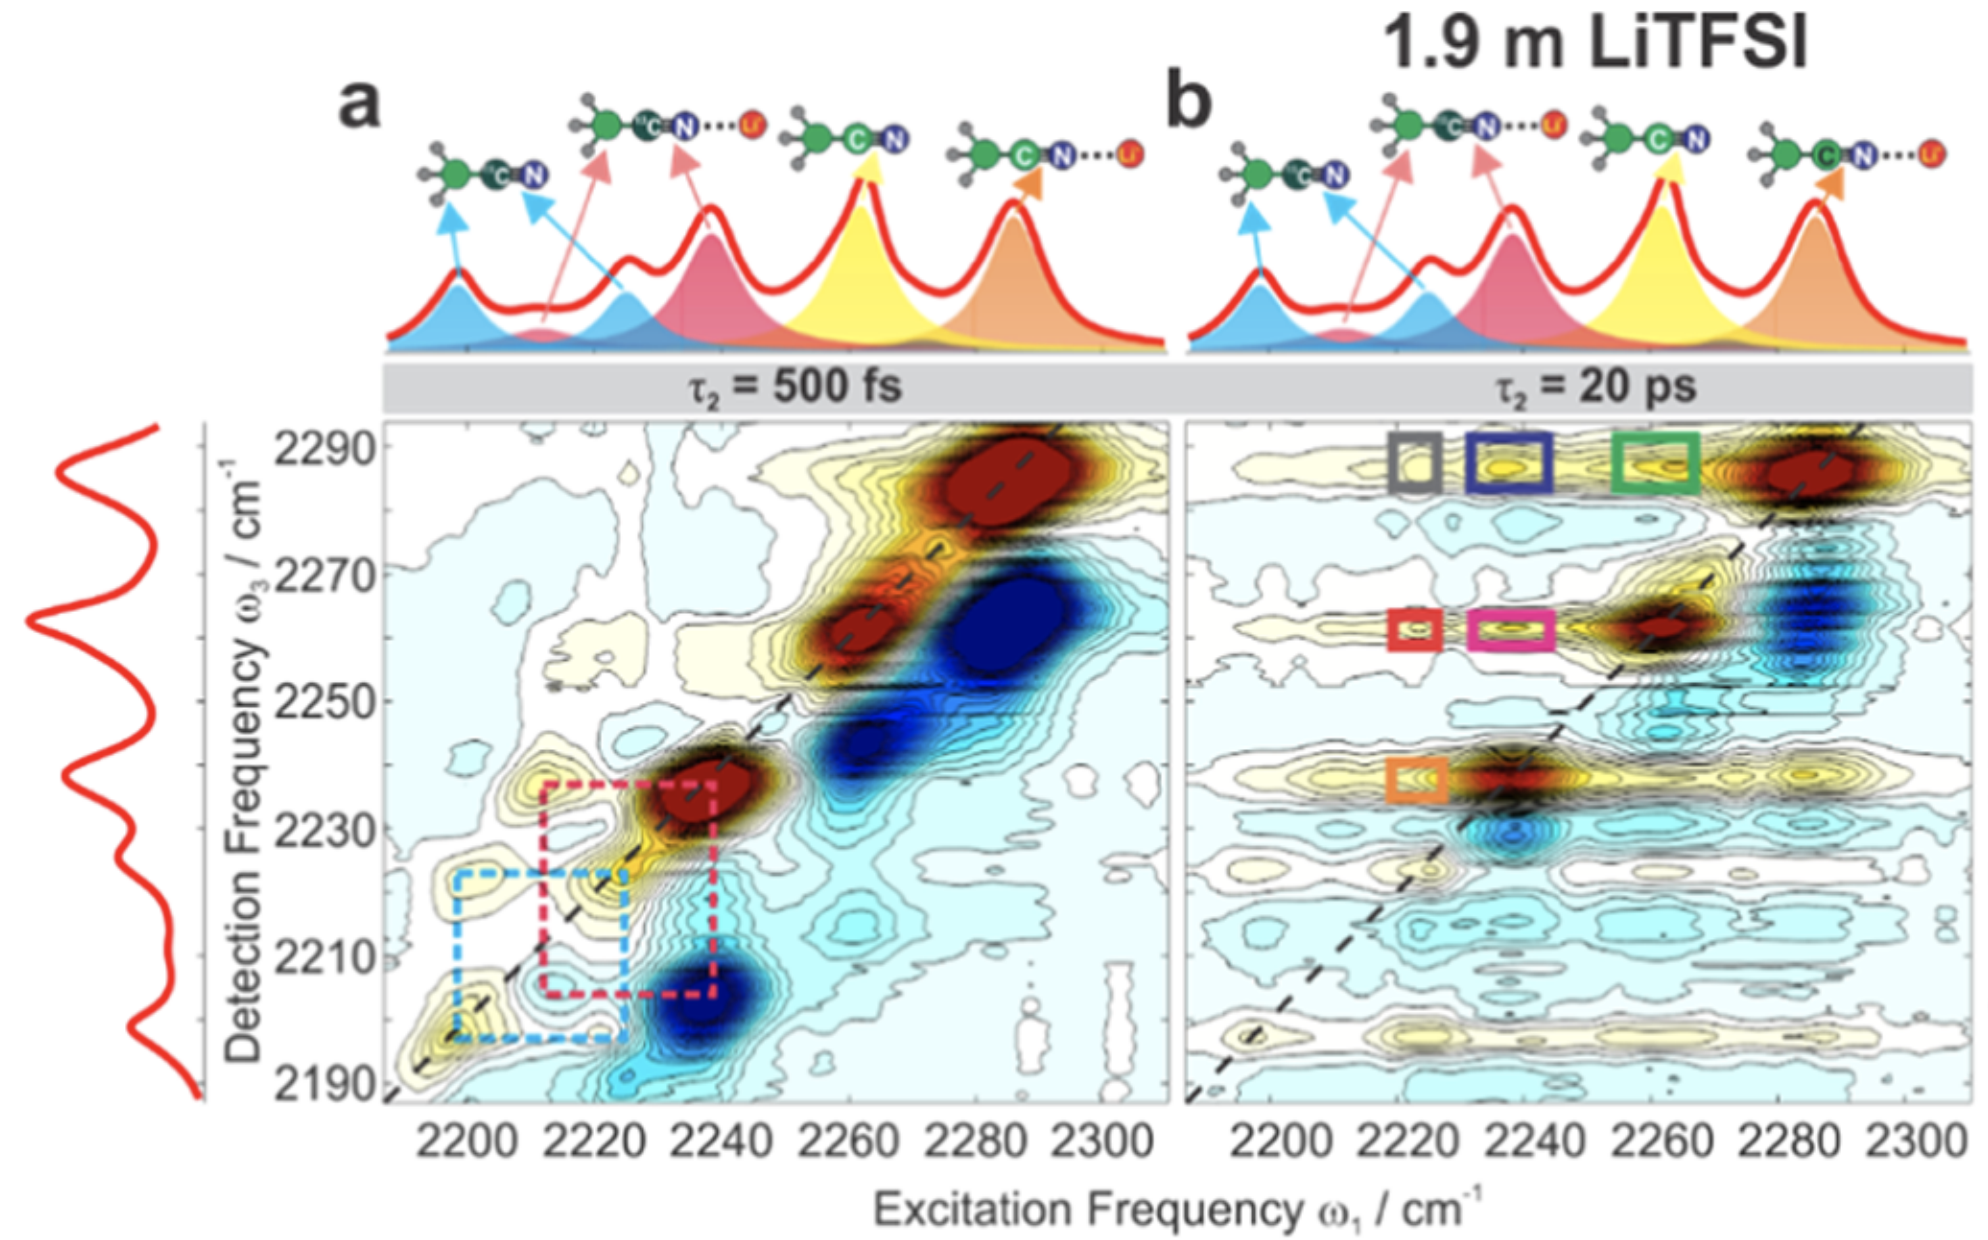
They find that the time evolution of all cross-peaks is identical under all conditions, indicating that solvent exchange must be slower than energy transfer (~20 ps) for any cation or concentration studied. This suggests that, contrary to a variety of theoretical studies, structural-diffusion mechanisms for cation transport are quite slow and unlikely to be relevant for these electrolytes.
This study is a beautiful example of designing a cutting-edge spectroscopic experiment to solve a key scientific problem, and reminds me how much we still don’t know about “simple” systems like ionic solutions. I would love to see techniques like this applied to study reactive intermediates in the ground state, e.g. Olah-style superacid solutions! More broadly, it’s exciting to see how 2D IR can advance in less than two decades from being limited to simple model systems to now being used to tackle the biggest open questions in chemistry. What new techniques being developed today will rise to prominence in the coming decades?
Thanks to Joe Gair for reading a draft of this.