Introduction

Figure 1: Artistic representation of Trump’s effect on the stock market.
No American President before Donald J. Trump has possessed so instantaneous and direct a line of communication with the public. Through Twitter, Trump can quickly indicate to investors, businesses, and foreign powers what the executive policy of his administration will be, which can have concomitant (and drastic) effects on domestic and foreign markets.
A few instances of this are shown below:

Figure 2: NBC headline from August 23rd, 2019
On August 22nd, 2019, China anounced retaliatory tariffs against the United States as a part of the ongoing US/China trade war. Then at 9:59 the President tweeted “Our great American companies are hereby ordered to immediately looking for an alternative to China.” According to CNBC, shortly thereafter “the Dow Jones Industrial Average fell more than 435 points, or 1.6%, while the S&P 500 slid 1.7% and the Nasdaq Composite dove 2%” (Figure 2). This demonstrates the virtually instant effect that Trump’s utterances can have on market confidence.
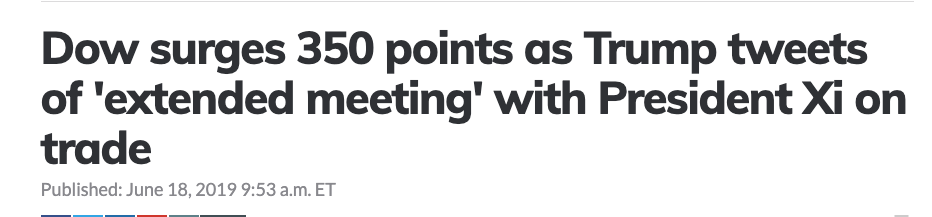
Figure 3: MarketWatch headline from June 18th, 2019
Conversely, in June Trump tweeted “Had a very good telephone conversation with President Xi of China. We will be having an extended meeting next week at the G-20 in Japan”, which had a dramatic effect: the S&P 500 index (SPX) climbed 1.3%, while the Nasdaq Composite Index (COMP) advanced 1.8% (Figure 3).
These two anecdotes, while not by themselves conclusive, demonstrate how President Trump’s words have the power to affect markets (and effect change) under extreme circumstances. But to what degree do his words actually affect market indices? Which words are most associated with the markets’ rise and fall?
In this project, we set to try to understand how the President’s tweets affect these various markets. Specifically, we attempted to train neural nets on tweet-derived data to predict variance in log-adjusted stock prices, bond prices, and commodity prices. Despite the numerous challenges inherent in such an undertaking (including the vast complexity of global markets, the limitations of computer-derived predictors to capture the content of Trump’s tweets, and the problems associated with delayed market response over time), we have been able to achieve limited success and—more importantly—learn valuable lessons about the shortcomings of our work, and opportunities for future researchers to make headway in this important area.
Previous Work:
In carrying out this research, we leaned heavily on previous work on text analysis and market modelling.
Text Analysis:
One approach to modelling tweets that we pursued was topic modelling, which models documents as distributions over topics and topics as distributions over words. Although tracing the precise genesis and evolution of this idea could be a review article in its own right, the reference we found most inspiring was by Jordan and coworkers, from 2003, which applied an approach they termed latent Dirichlet allocation to perform dimensionality reduction for large bodies of text (Ref. 1).
Another complementary approach to modeling text data is word embeddings. Word space is many hundreds of thousands of dimensions (one dimension per word in discrete space), but word meanings can be embedded in a smaller, continous space. One type of model that learns word representations is Word2Vec, which is a group of models trained by Google to estimate word embeddings in 300-dimensional space. Similaries between words can be captured by cosine similarities in vector space. (Ref. 2).
A more recent (and advanced) version of topic modelling, which uses word embeddings to improve performance on large and irregular bodies of text, was also helpful for shaping our approach (although we did not ultimately employ this precise method) (Ref. 3).
Another approach which we used to model Twitter data was sentiment analysis, which attempts to classify the emotions behind a piece of text. Passonneau and coworkers employed this strategy to categorize tweets into positive, negative, or neutral, which is akin to the one-dimensional sentiment response variable we used (Ref. 4).
Sentiment analysis has also been used to train a SVM to predict a given company’s stock prices based on tweets about that company, with moderate success (Ref. 5). (Notably, there was found to be a sizeable delay between tweets about a company and the corresponding stock changes, which emphasizes the importance of lookback predictors). A related paper which used randomly-sampled tweets to predict overall market performance (more akin to this project) also used various forms of sentiment analysis to describe their tweets (Ref. 6.).
Market Analysis:
The log-normal description of stocks employed here was adapted from Blyth’s Introduction to Quantitative Finance (Ref. 7). Additional theoretical support for our approach came from Blitzstein and Hwang’s Introduction to Probability (Ref. 8).
Our approach to modelling stocks with moving averages was informed by Malcius’s review on the use of moving averages in finance (Ref. 8).
References:
-
Blei, D. M.; Ng, A. Y.; Jordan, M. I. Latent Dirichlet Allocation. J. Mach. Learn. Res. 2003, 3, 993–1002.
-
Mikolov, T.; Chen, K.; Corrado, G.; Dean, J. [Efficient Estimation of Word Representations in Vector Space]. Proceedings of Workshop at ICLR 2013.
-
Dieng, A. B.; Ruiz, F. J. R.; Blei, D. M. Topic Modelling in Embedding Spaces. 2019, arXiv:1907.04907.
-
Agarwal, A.; Xie, B.; Vovsha, I.; Rambow, O.; Passonneau, R. Sentiment Analysis of Twitter Data. Proceedings of the Workshop on Language in Social Media, 2011, 30–38.
-
Smailovic, J.; Grcar, M.; Lavrac, N.; Znidarsic, L. Predictive Sentiment Analysis of Tweets: A Stock Market Application. International Workshop on Human-Computer Interaction and Knowledge Discovery in Complex, Unstructured, Big Data, 2013, 77–88.
-
Pagolu, V. S.; Challa, K. N. R.; Panda, G.; Majhi, B. Sentiment Analysis of Twitter Data for Predicting Stock Market Movements. 2016, arXiv:1610.09225.
-
Blyth, S. An Introduction to Quantitative Finance. Oxford University Press: Oxford, 2013.
-
Blitzstein, J. K.; Hwang, J. Introduction to Probability. CRC Press: London, 2014.
-
Raudys, A.; Lenciauskas, V.; Malcius, E. Moving Averages for Financial Data Smoothing. International Conference on Information and Software Technologies, 2013, 34–45.